How to Read Market Trends Using New Highs, New Lows, and Trading Volume Rankings
Key Summary: Changes in actual transaction price rankings—increases and decreases —are based on comparisons with the previous transaction, while new highs and new lows are based on comparisons with the entire historical record. Therefore, when assessing market changes, it is advisable to look at both whether a new high has been reached and whether trading volume has increased. Since rankings can shift due to a single transaction, be sure to check the records for units of the same size.
It is difficult to understand how the market is moving by looking only at the prices of individual complexes. Home Insight’s rankings use real transaction price data (sales) released by the Ministry of Land, Infrastructure and Transport to show "where and what is happening right now." We have summarized the meaning of each ranking and points to keep in mind when interpreting them.
Actual Transaction Price Ranking — Increase, Decrease, and Trading Volume
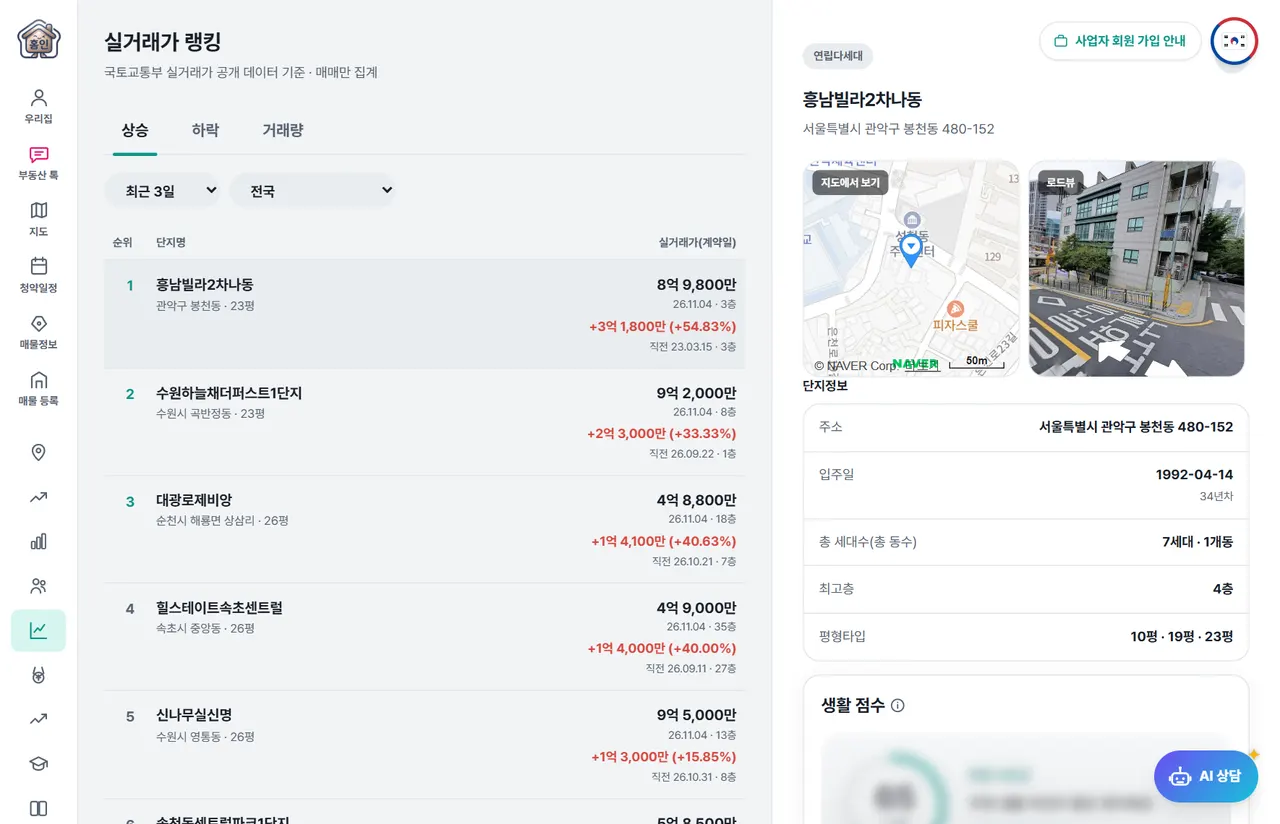
The Actual Transaction Price Ranking displays three rankings based on transactions over the past 3 days, 1 week, and 1 month. You can also select a city or province to view rankings by region.
- Rise/Down — This refers to how much the price has risen or fallen compared to the previous transaction of the same complex and same size unit.
- Trading Volume — It is a complex with a high volume of transactions during the period.
The point of "compared to the previous transaction" is important. If the previous transaction was for a lower floor or a distressed sale, this transaction may appear to have "increased" significantly. If you see a large fluctuation, click on the complex to check the entire transaction history for the same unit size.
New Highs/New Lows — Compared to the entire historical record
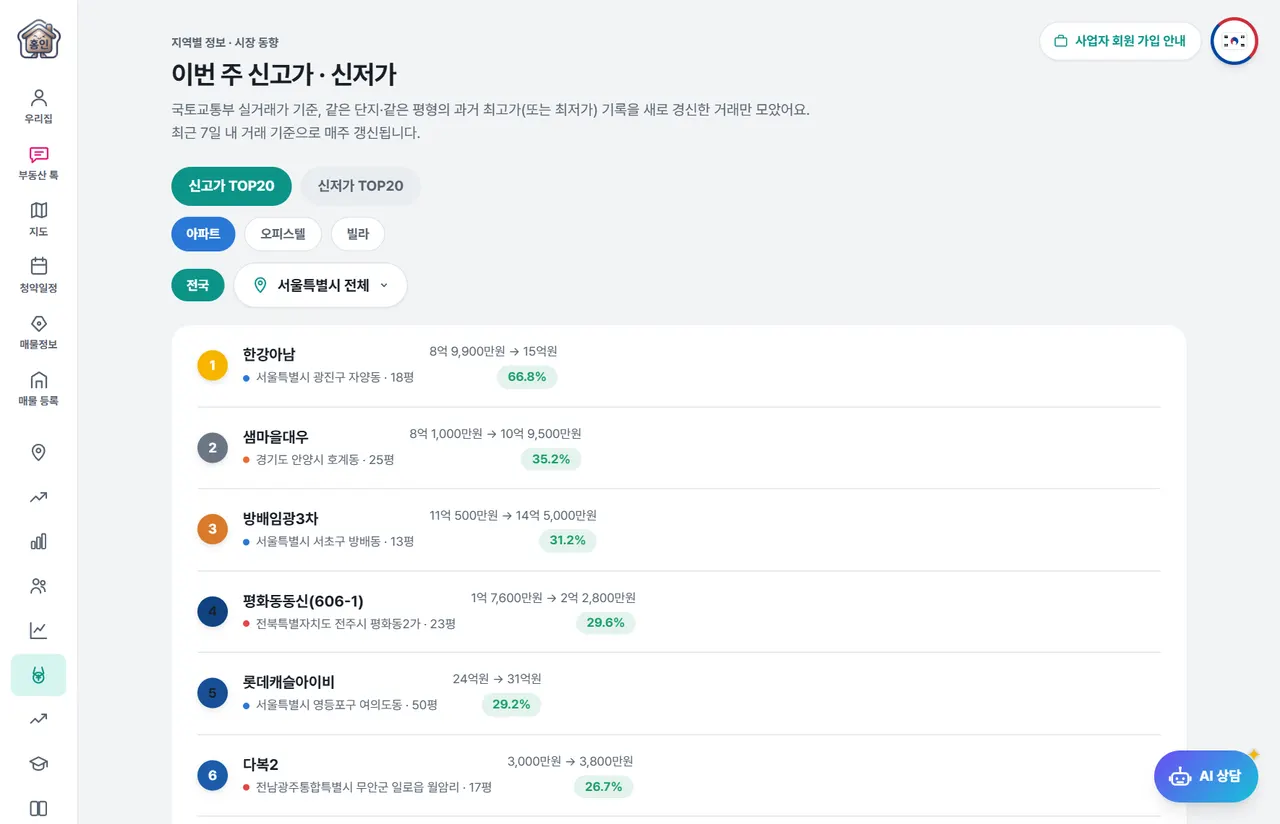
New Highs and New Lows collect only transactions from the past week that are higher than the all-time highest price or lower than the all-time lowest price for the same complex and same floor plan. Because it compares with the entire record rather than the most recent transaction, you can determine if it is a genuine "record high." You can view apartments, officetels, and villas categorized by type.
If record highs are concentrated in a specific area or multiple complexes within the same region record highs in succession, it could be a sign that demand in that area is strengthening. Conversely, in areas where record lows continue to rise, a price correction may be in progress.
Popular Apartments — Transaction Rate Compared to Number of Units
Popular apartment rankings are determined by the transaction rate, which is calculated by dividing the number of transactions by the number of households. Since large complexes inevitably have a high volume of transactions, the transaction rate is a more fair indicator of trading activity considering their scale. For more details, please refer to Finding Apartments with Active Trading .
Points to note when interpreting rankings
- Representativeness of a single transaction — Rankings are determined by individual transactions, so special deals such as lower floors, urgent sales, and direct transactions between family members may be mixed in.
- Reporting Delay — Reports are received up to 30 days after the contract, so the recent period ranking may change over time.
- Periods with low trading volume — During periods of infrequent trading, even just a few transactions can significantly shift the rankings.
- Differences in Type — Apartments, officetels, and villas belong to different markets, so it is best to view them separately.
Try using it like this
- I check every week to see how often complexes in my area of interest appear on the list of new highs and new lows.
- Check the actual transaction price ranking to see if trading volume has also increased. Cases where the price rose due to increased trading volume are more meaningful than cases where it rose by just one or two transactions.
- For prominent complexes, check multiple recent transactions of the same size in the complex details.
If you want to see changes in interest levels in advance, also check out how to read neighborhood interest using the rate of change in real estate money supply .
Frequently Asked Questions
By what criteria is the reported price determined?
It is a transaction that exceeded the highest price among all past transactions of the same complex and same floor plan. We search based on transactions from the past week.
For complexes with high growth rates, has the market price risen by that much?
That is not necessarily the case. Since the rate of increase is calculated by comparing it to the previous transaction, if the previous deal involved a lower floor or a distressed sale, the figure may appear higher than the actual market price change.
Why does the ranking change after a few days?
This is because reports are received up to 30 days after the contract. As late-reported transactions are added, the rankings for the same period may change.
Related guides
- Finding an Apartment with Active Trading — How to Read the Transaction Rate Relative to Households and Neighborhood Population Composition
- How to Read AI Reports — From Judgments and Checkpoints to Positive and Negative Factors
- How to Properly Read Actual Apartment Transaction Prices — From Area and Floor to Transaction Timing