How to Properly Read Actual Apartment Transaction Prices — From Area and Floor to Transaction Timing
Key Summary: Actual transaction prices should be viewed as multiple recent transactions of the same exclusive area, not a single one. Prices for units of the same size vary significantly depending on the floor, building, and whether it is a direct transaction; furthermore, since the reporting deadline is 30 days, recent transactions are recorded late. When looking at the average, be sure to check which unit sizes and time periods are included.
Actual transaction prices are the most objective data indicating "how much something actually sold for." However, it is easy to misunderstand if you judge based solely on the numbers. I have summarized how actual transaction prices are calculated and what factors to consider alongside them.
Where do actual transaction prices come from?
When buying or selling real estate, a transaction report must be filed within 30 days of the contract date, and the Ministry of Land, Infrastructure and Transport discloses this data through the Real Transaction Price Disclosure System. Home Insight collects this disclosed data daily and organizes it by complex.
Please keep two things in mind because of this structure.
- Recent transactions appear late. It can take up to 30 days from the contract to the report, so this month's transactions will be filled in next month.
- There is a canceled transaction. When a contract is cancelled, a cancellation report is received, and Home Insight excludes the cancelled transaction from the market price calculation.
The reason why prices differ in the same complex
For example, in September 2026, at a large complex in Gangdong-gu, Seoul, the same unit with an exclusive area of 84.99㎡ was traded for both 2.3 billion won and 3 billion won. The reasons for such a difference within a single complex are as follows.
- Area (square footage) — it is the biggest factor. You should always compare units with the same exclusive area.
- Floor — There is a significant price difference between lower and upper floors. Please also check the floor-by-floor prices in the AI report.
- East, Orientation, View — Buildings facing south, with views of parks or rivers, or those close to the station are traded at higher prices.
- Transaction Method — Direct transactions without an intermediary may include prices different from the market rate, such as in transactions between family members. The Home Insight transaction list indicates whether the transaction is a direct deal.
- Trading Timing — Even within the same year, prices differ between rising and falling periods.
So, it is important to look at several recent transactions of the same size together, rather than just one.
The Trap of Averages
"Average sale price" is convenient, but its meaning changes depending on what is mixed in when averaging.
- The average for mixed unit sizes appears high during periods when there were many transactions for larger units.
- The average of transactions over several years differs significantly from the current market price.
Home Insight calculates regional average prices separately for the past year and by 59 and 84 unit types (extending to 5 years only if there are no transactions during that period). In the complex details, please select the unit size and change the time period (All, Last 3 Years, Last 5 Years) to view the data.
How is the price per pyeong calculated?
The price per pyeong is calculated by dividing the price by the area. Home Insight calculates this based on an exclusive area of 3.3㎡ (1 pyeong) . Since the figures may differ from sources that calculate based on the gross floor area, please be sure to check the standard area when comparing with other data.
Price per pyeong is useful when comparing price levels between complexes of different sizes. In the complex details, you can compare the price per pyeong of that complex side-by-side with the average of the same Dong, Si, Gun, Gu, and Si.
Check actual transaction prices in complex details
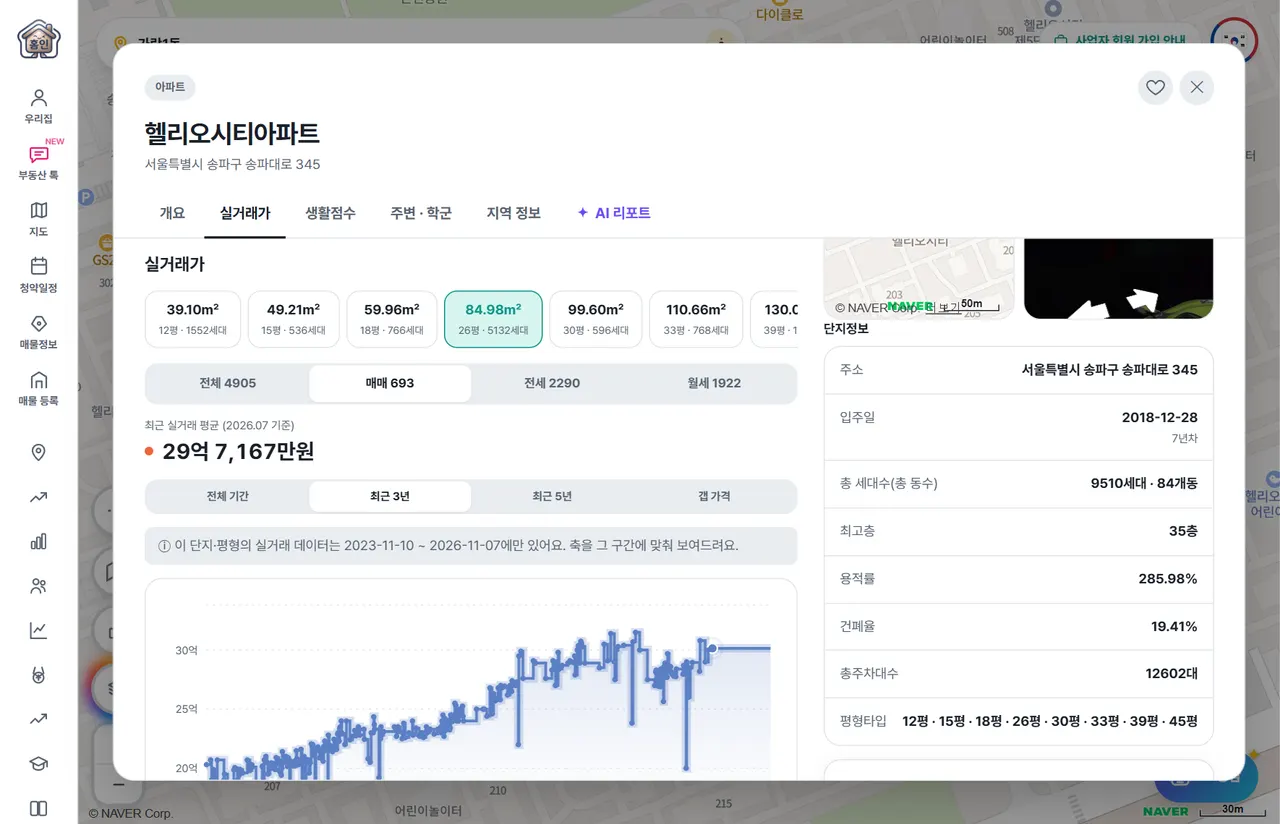
Zoom in on the map and tap the complex badge to open the complex details. You can view the actual transaction price area like this.
- Select the exclusive area from the floor plan card above.
- Select the transaction you want to view from Sale, Jeonse, or Monthly Rent .
- Narrow the period to the last 3 or 5 years to look at the trends.
- Check the floor and whether it is a direct transaction in the transaction list below the graph.
On PC, navigate to the top menu for details, and on mobile, press the top chip from the details that pop up from the bottom of the screen. The mobile details close by swiping down the top handle.
Checklist for Checking Actual Transaction Prices
- Did you compare units with the same exclusive area ?
- Have you seen several transactions recently?
- Did you check the floor and whether a direct transaction is possible ?
- Did you take into account that recent transactions may not all be uploaded yet due to the reporting deadline ?
For information on how to view the overall market trend, please continue in "How to Read Market Trends Using New Highs, New Lows, and Volume Rankings ."
Frequently Asked Questions
How do actual transaction prices and asking prices differ?
The actual transaction price is the price reported after a contract is actually concluded, while the asking price is the price the seller desires. Since the asking price is the price before a transaction is finalized, you must compare it with recent actual transaction prices for properties of the same size.
How do I check for unlocked transactions?
A "Unreleased" indicator is attached to the transaction list. Home Insight excludes transactions reported as unreleased from price calculations and also displays the unrelease rate for the past 12 months in the AI report.
How should I interpret the market price if there have been no recent transactions?
Extend the timeframe to the last 3 or 5 years to observe trends, and compare them with transactions in similar complexes within the same neighborhood. The "Similar Nearby Complexes" section of the AI report is helpful.
Related guides
- How to Read Market Trends Using New Highs, New Lows, and Trading Volume Rankings
- Finding an Apartment with Active Trading — How to Read the Transaction Rate Relative to Households and Neighborhood Population Composition
- How to Read AI Reports — From Judgments and Checkpoints to Positive and Negative Factors