Finding an Apartment with Active Trading — How to Read the Transaction Rate Relative to Households and Neighborhood Population Composition
Key Summary: The transaction rate is calculated by dividing the number of transactions by the number of households , so you can identify areas with active trading regardless of the complex's size. However, since high transaction rates are due to various factors such as increased demand, new housing supply, and price adjustments, you must also examine whether the rate increased while prices were rising or falling.
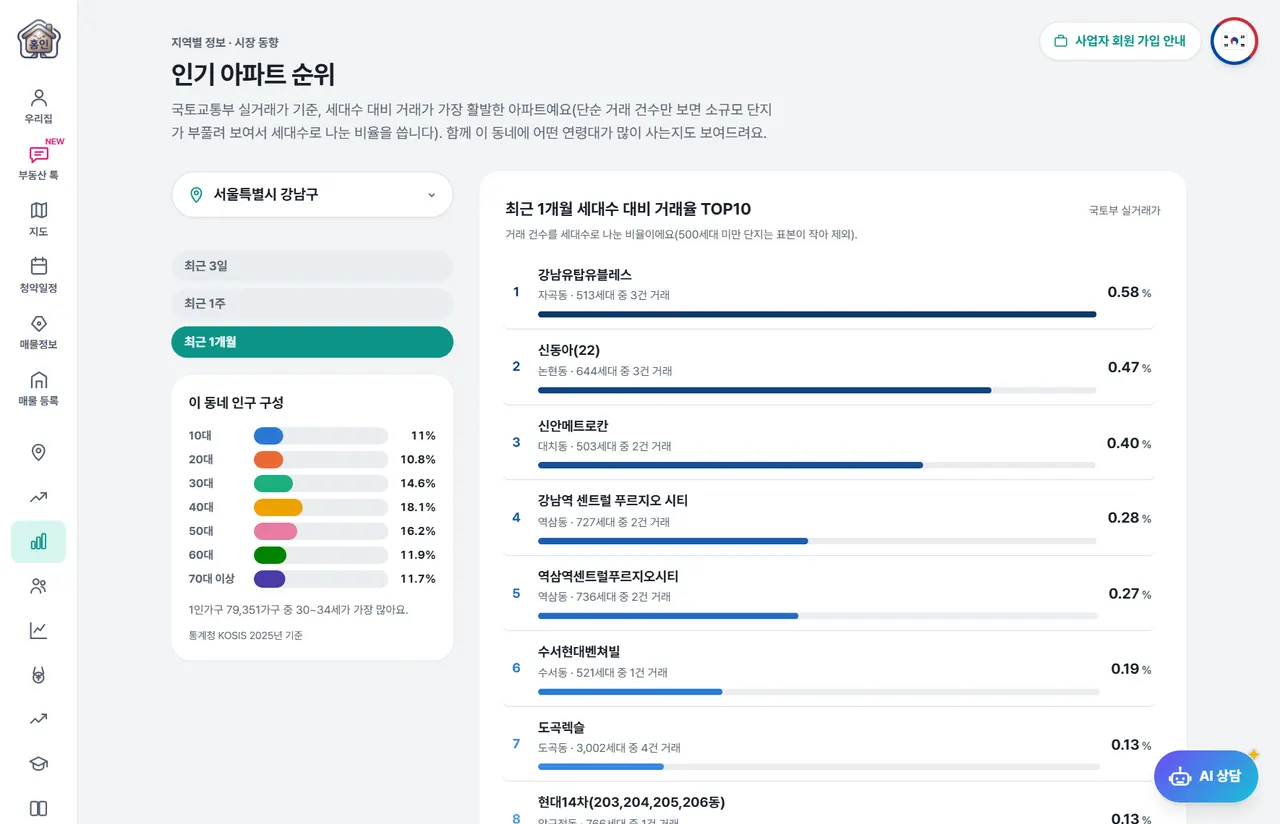
"Complexes with high transaction volumes these days" are a good clue indicating where demand is concentrated. However, if you count only the number of transactions, large complexes with many households always rank at the top. Home Insight has summarized why transaction rates are used in its popular apartment rankings and how to read them.
The transaction rate is
The transaction rate is the ratio of the number of sales transactions within a period to the number of households. For example, if 10 transactions occur in a month in a complex of 1,000 households, the transaction rate is 1%. If 15 transactions occur in a complex of 3,000 households, the number of transactions is higher, but the transaction rate is 0.5%, meaning the former complex is more active relative to its size.
Home Insight only includes complexes with 500 or more households in its rankings. This is because for complexes with fewer households, the transaction rate can spike significantly with just one or two transactions. You can select the period from the last 3 days, 1 week, or 1 month.
Cases where the trading rate is high
A high trading rate means there are many people buying and selling, but there are various reasons for this.
- Cases where demand surges — when buying pressure is strong due to favorable transportation developments or demand for school districts
- New apartment move-in period — Immediately after moving in, a large volume of properties for sale comes onto the market at once, leading to an increase in transactions.
- Price Adjustment — Transactions can increase even as listings are absorbed as prices drop.
Therefore, for complexes with high transaction rates, you need to check whether the increase in transactions occurred as prices rose or fell. You can find this out by looking at the actual transaction price graph in the complex details.
Reading the neighborhood population composition
On the popular apartments screen, you can also view the neighborhood's population composition by age group using data from the Korea National Statistical Information Service (KOSIS).
- If the proportion of people in their 30s and 40s and children under 10 is high, it is likely a neighborhood with many households raising children. There is a steady demand for schools and private academies.
- If the proportion of people in their 20s and 30s is high, it is often an area with good access to workplaces or a lot of small houses.
- If the proportion of people aged 60 or older is high, it is likely an old residential area. It is good to consider this in conjunction with reconstruction and redevelopment issues.
In the complex details, under Surroundings and School Districts, you can also view the gender and age distribution of the neighborhood where the complex is located.
Population composition shows "who is buying now," and transaction rates show "how much is being bought and sold." By looking at the two together, you can grasp the character of the neighborhood and the market atmosphere.
Recommended articles to read together
- 7 Indicators to Check When Choosing a Neighborhood
- How to Read Market Trends Using New Highs, New Lows, and Trading Volume Rankings
- How to Read Neighborhood Interest Using Real Estate Money Supply Change Rates
Frequently Asked Questions
How is the trading rate calculated?
Divide the number of sales transactions within the period by the number of households in the complex. If 10 transactions occur in a month in a complex of 1,000 households, the transaction rate is 1%.
Why are complexes with fewer than 500 households not on the ranking?
If the number of households is small, the transaction rate spikes significantly with just one or two transactions, making comparison difficult. Therefore, we only include complexes with 500 or more households in the rankings.
Is a complex good if it has a high transaction rate?
It simply means that trading is active; it does not imply anything is good or bad. Transactions could increase due to new housing supply or falling prices, so you need to monitor price trends as well.