How to Read Neighborhood Interest Using Real Estate Money Supply Change Rates
Key Summary: The money supply change rate is an indicator showing how much the volume of calls from real estate agencies has increased or decreased compared to the previous week . While it can reveal changes in interest before actual transactions, weekly figures are significantly affected by factors such as holidays. Please observe the trend over several consecutive weeks and evaluate it in conjunction with trading volume and prices.
People looking to buy a house usually call a real estate agency before making a transaction. Therefore, the call volume at real estate agencies can serve as an indicator of market interest even before actual transaction prices.
Where does the data come from?
The real estate money supply change rate uses data on the weekly change rate of real estate money supply by region provided by the SK Open API. It is updated weekly at the city/county/district level and shows how much it increased or decreased compared to the previous week, rather than the money supply itself.
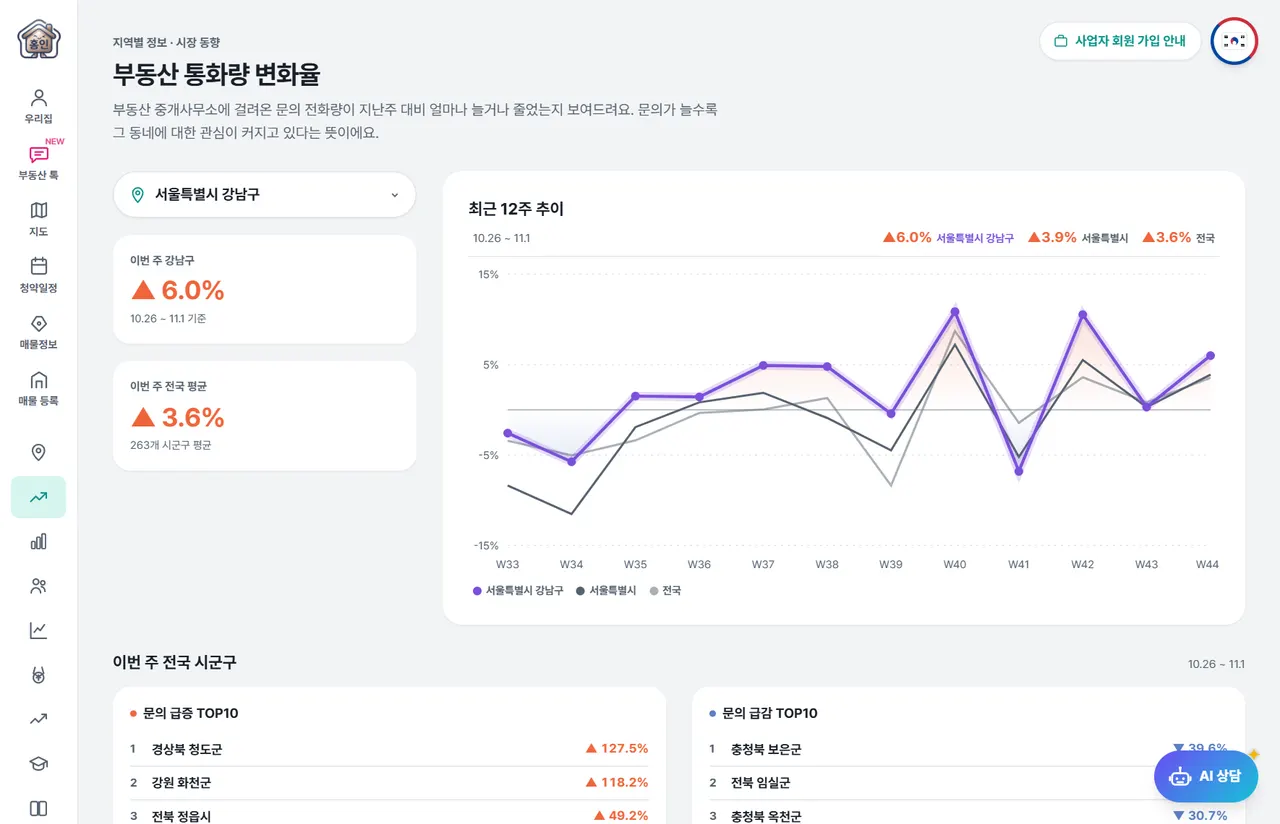
Read it like this
- This week's rate of change — Compare this week's figures for the even region and the nation.
- Recent 12-week trend — View trends across regions, cities/provinces, and the entire country in a graph.
- Top 10 Areas with the Surge in Inquiries — These are the regions with the highest increase in call volume compared to last week. They may be areas that have garnered new interest.
- Top 10 Areas with Sharp Decline in Inquiries — These are regions where call volume has dropped significantly.
- Map Layer — If you turn on the rate of change in currency volume from the layer button at the bottom left of the map , you can see regional changes in color.
Points to note when interpreting
- Since it is compared to the previous week, the baseline effect is significant. If last week was a holiday, this week appears to have increased greatly.
- Don't just look at one week. It is more important to see how many consecutive weeks it increases.
- Call volume is interest, not price. Calls to real estate agencies can include not only inquiries about buying but also inquiries about selling and renting.
View with other indicators
If call volume has been increasing in your area for several weeks, please check the following.
- Whether the complex in that area has started appearing on the list of new highs and new lows
- Whether trading volume increased in the actual transaction price ranking
- Whether the price trend graph in the regional information has changed direction
Money supply is interest, trading volume is actual action, and price is the result. Market changes can be considered more certain when these three point in the same direction.
I have summarized how to read the rankings in "How to Read Market Trends with New Highs, New Lows, and Volume Rankings ."
Frequently Asked Questions
Do housing prices rise if the money supply increases?
That is not necessarily the case. Call volume merely indicates interest, and it is mixed with inquiries for selling and renting. You need to look at whether trading volume and price are moving in the same direction.
How often is it updated?
It is updated weekly at the city/county/district level. Therefore, you cannot see daily changes.
Can I also see the actual number of calls?
No. Only the rate of change compared to the previous week is provided, not the number of calls.