7 Indicators to Check When Choosing a Neighborhood — How to Use the Local Page
Key Summary: When choosing a neighborhood, it is recommended to look at seven factors together —market price ranking, Jeonse ratio, differences by neighborhood, representative complexes, population flow, safety index, and air quality— rather than just price. You can view this information on a single page by selecting a city/province and city/county/district in the regional information section .
When choosing a neighborhood, you should look at not only the price but also "what it is like to live there." If you select a city/province and a city/county/district in the regional information , you can view the indicators below on a single page.
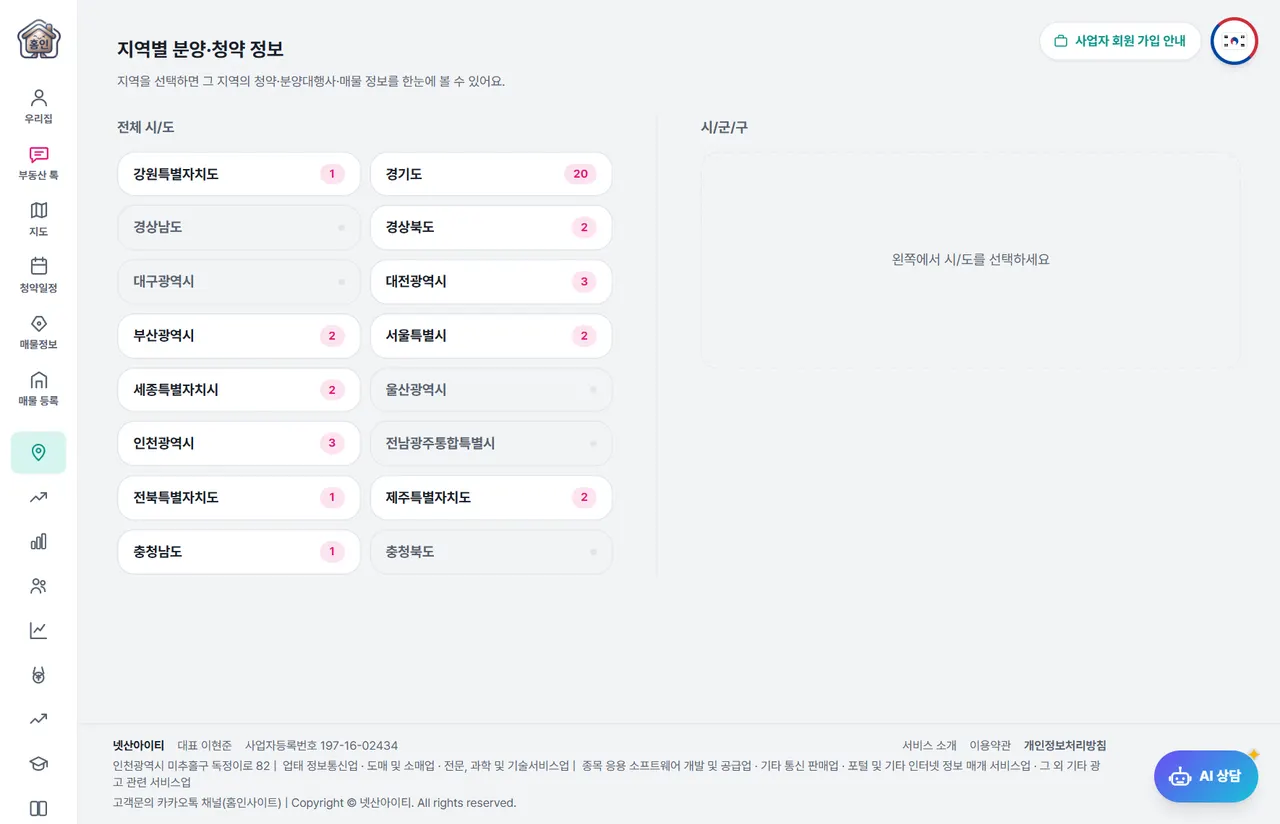
1. Average Actual Transaction Price and Ranking
The price trend at the top of the region page displays the average actual transaction prices for apartments over the past year, divided into 59-type (exclusive area 55–60㎡) and 84-type (exclusive area 80–85㎡). It also shows the ranking within the same city or province, allowing you to immediately gauge the price range of the neighborhood.
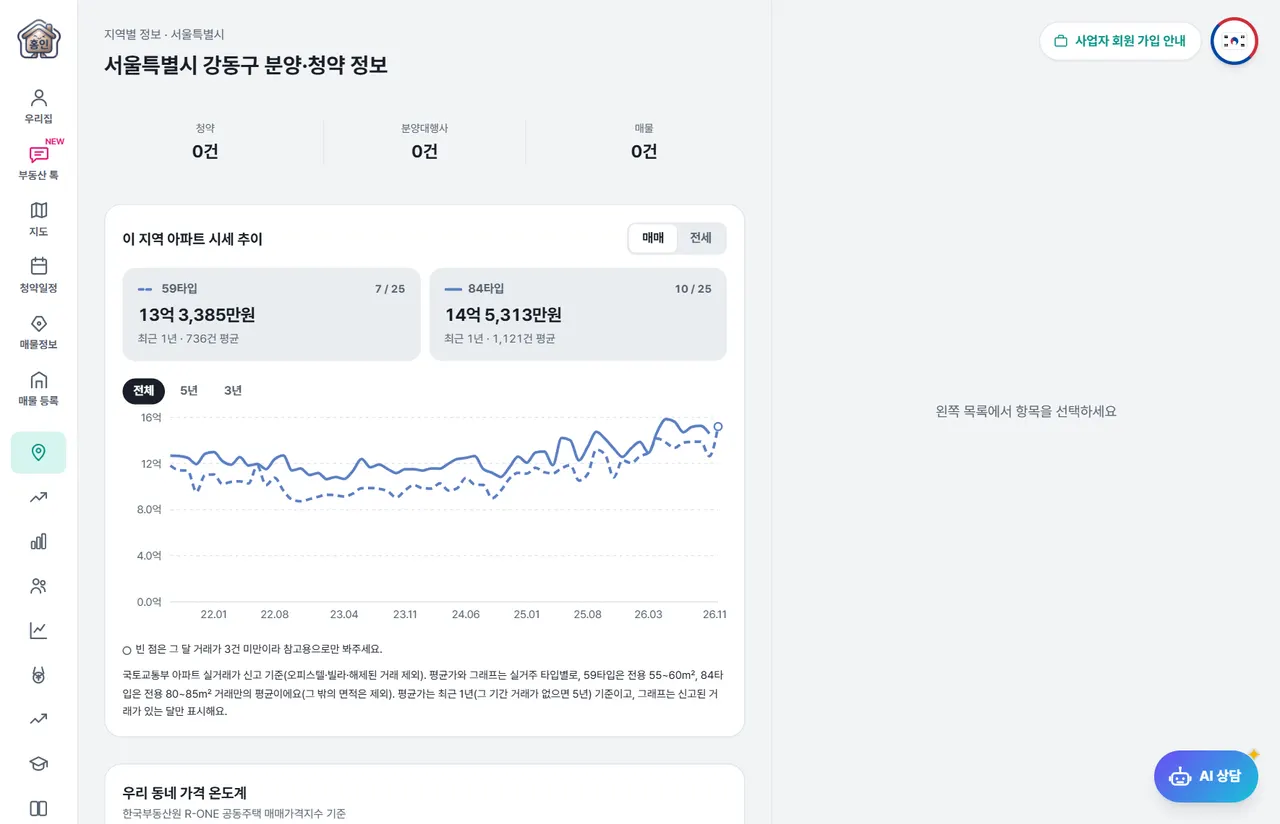
Taking Gangdong-gu, Seoul (last year) as an example as of November 2026, it is as follows.
- Average sale price for Type 59 units is approximately 1.334 billion won, ranking 7th among Seoul's 25 districts.
- Average sale price for 84-type units is approximately 1.453 billion won, ranking 10th out of 25 districts in Seoul.
You can view the monthly flow on the graph, and only the months in which transactions occurred are displayed.
2. Jeonse price ratio
The Jeonse-to-sale price ratio is the ratio of the Jeonse price to the sale price. If the average Jeonse price for an 84-type unit in Gangdong-gu is approximately 698 million won, it is about 48% of the average sale price.
- If the Jeonse ratio is high, the difference between the sale price and the Jeonse price is small, allowing you to purchase with less money; however, there is also a high risk that it will be difficult to get your Jeonse deposit back if the sale price falls.
- If the Jeonse price ratio is low, it can be seen that expectations for future value are reflected in the price more than demand for actual residence.
If you are moving into a house on a Jeonse basis, be sure to check the Jeonse ratio of the complex and the senior liens on the land registry together.
3. Comparison of Market Prices and Trading Volumes by Dong
Even within the same district, prices and transaction volumes vary significantly by neighborhood. Check which neighborhoods are expensive and which have active trading by comparing data by neighborhood (based on the last 5 years). Even within Gangdong-gu, the average sale price in Godeok-dong and Gil-dong differs by more than double.
4. Complex Ranking
It shows the representative complexes of that region based on four criteria.
- Highest Price — Order of most traded in the last year
- Popularity — Ranked by active trading relative to the number of households (500 households or more)
- Total market value — simply ranked by largest total value
- Large complexes — in order of largest number of households
If you click on the complex, it leads directly to the complex details.
5. Population Trends
Inflows, outflows, and age demographics reveal changes in a neighborhood. Long-term demand differs between neighborhoods with a steady influx of young people and those experiencing population outflow. Compare regions in the Regional Population Trends .
6. Neighborhood Safety Index
It is an indicator that converts crime rates relative to the population into a score, based on crime statistics from the National Police Agency. Since it is calculated based on the registered population, downtown and commercial districts with many visitors and office workers may receive lower scores than what is actually perceived. You can view the national rankings in the Neighborhood Safety Index .
7. Air quality
It displays the air quality of the area using data from Air Korea (Korea Environment Corporation) monitoring stations. It is available only in areas connected to nearby monitoring stations.
Also look at positive and negative factors.
In the "Good News & Bad News" section, AI analyzes published news and posts to gather and display news by region. The date on the card is the analysis reference date.
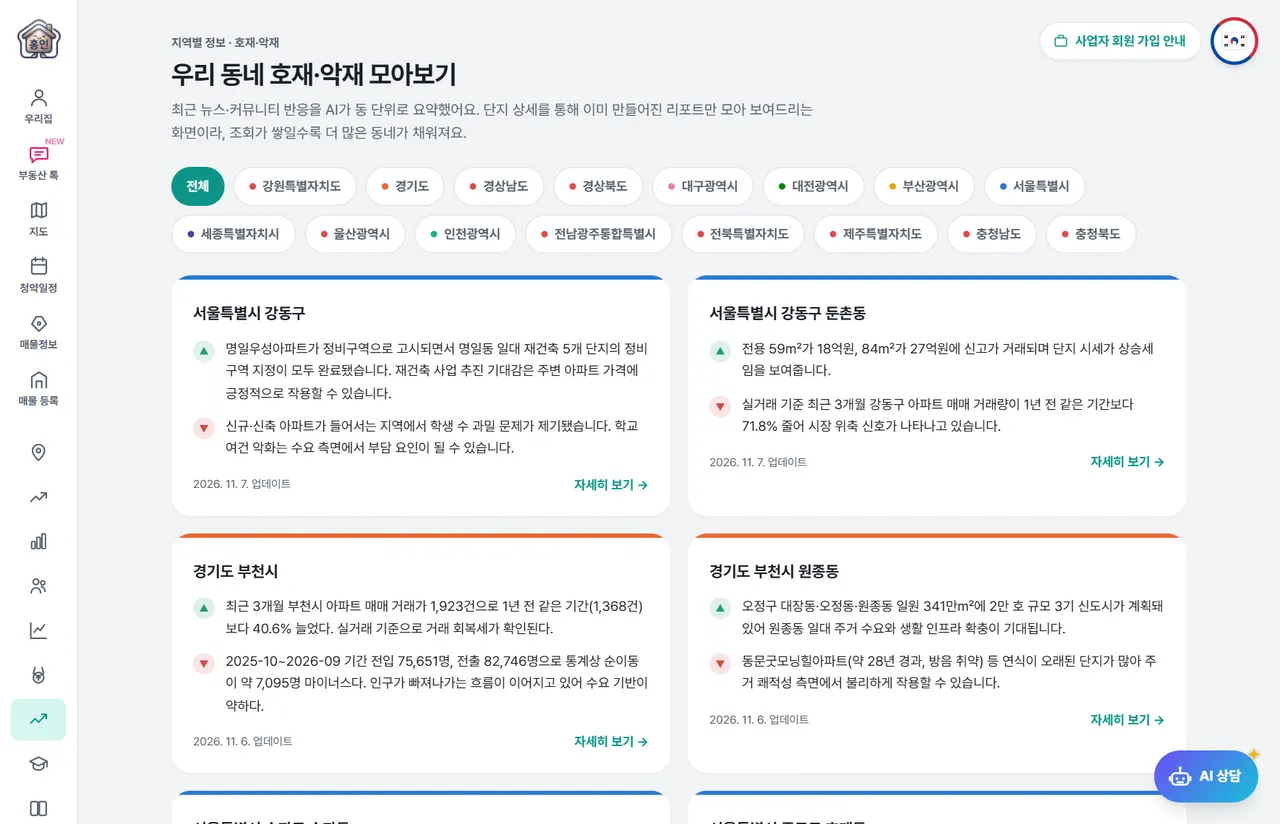
I have summarized how to read it in "How to Read AI Reports ."
Recommended menus to check out together
- School Districts & Station Areas — Rankings of Accessibility to Schools and Subway Stations
- Regional Comparison — Compare indicators of two regions side by side
- Rate of change in real estate money supply — Weekly change in neighborhood interest
Frequently Asked Questions
How is the Jeonse price ratio calculated?
It is the ratio of the average Jeonse price to the average sale price. If the sale price is 1 billion won and the Jeonse price is 500 million won, the Jeonse ratio is 50%. It is accurate to calculate this based on apartment sizes of the same size.
Is it dangerous if the Jeonse ratio is high?
Caution is required as it may become difficult to recover your Jeonse deposit if the sale price falls. If you are entering into a Jeonse lease, be sure to check the Jeonse ratio along with the senior liens on the Certificate of Land Registry.
Does a low neighborhood safety index mean the public safety is poor?
That is not necessarily the case. Since it is calculated based on registered population, downtown areas and commercial districts with high floating populations may appear lower than what is actually felt.
Where can I check the market prices in my neighborhood?
You can select City/Province and City/County/District in the Regional Information section . You can view differences at the Dong level in the Dong-by-Dong comparison on the same page.